Browse Services by Sector
Container ShippingContainer Equipment Assets
Ports and Terminals
Dry Bulk Shipping
Tanker Shipping
Gas Shipping
Specialised Shipping
Airfreight Transport
Logistics Management
Ship Operations and Management
Other popular areas
Browse subscriptions by Sector
Container ShippingPorts and Terminals
Dry Bulk Shipping
LPG Shipping
LNG Shipping
Crude Tanker Shipping
Product Tanker Shipping
Financial Advisory
Valuations
Drewry Financial Research Services Ltd is authorised by the UK Financial Conduct Authority (FCA).
News & Events
Faster transit times and easing port delays: light at the end of the tunnel for shippers?
London, UK, 06th July 2022 – After more than two years of chronic delays in container shipping, shippers are finally seeing continuing improvements in both transit times and in port delays, according to the latest metrics measured by Drewry Shipping Consultants.
Since January, port congestion in North America – the most congested region - has halved from 20 times the norm to about 10 times the norm, based on the Automated Information Systems (AIS) measurements analysed by Drewry in the latest Container Capacity Insight. Transpacific eastbound “best case” transit times (from the last port in Asia to the first port on the West Coast of North America) have shortened from about 34 days in January to 20 days last week.
Figure 1: North America: Port congestion Z-score indicators (No. vessels waiting)

Source: Drewry’s Container Capacity Insight
NB: Port congestion was “off scale” in the second half of 2021
Figure 2: Transpacific East-Bound - Best case transit times (last port in Asia to first port in WCNA)

Port congestion in North America, Europe, Asia, Middle East and Oceania remains elevated, by historical standards. The most impacted region remains North America, where the congestion has improved more on the West Coast than on the East Coast, as shippers worried about the negotiations between the International Longshore Warehouse Union (ILWU) and the Pacific Maritime Association (PMA) shifted volumes to the East Coast.
Since the start of this year, New York ship waiting times for a berthing window have averaged 3 days, growing to 5 days in the last four weeks. The adjacent port of Baltimore has been in the green so far, averaging less than one day of waiting time, thus representing a faster alternative for cargo destined for this region.
The port congestion metrics for neighbouring ports and the transit time trackers are technology-supported tools provided to shippers by Drewry to support routing decisions and planning.
The tools and market insight are updated weekly in the Container Capacity Insight. Transit times of the major East-West ocean services, another key factor of the containers’ journey, remain much worse than the pre-pandemic benchmark (year 2019), but we see an improvement in the latest weeks, as illustrated in see figure 2.
About Container Capacity Insight
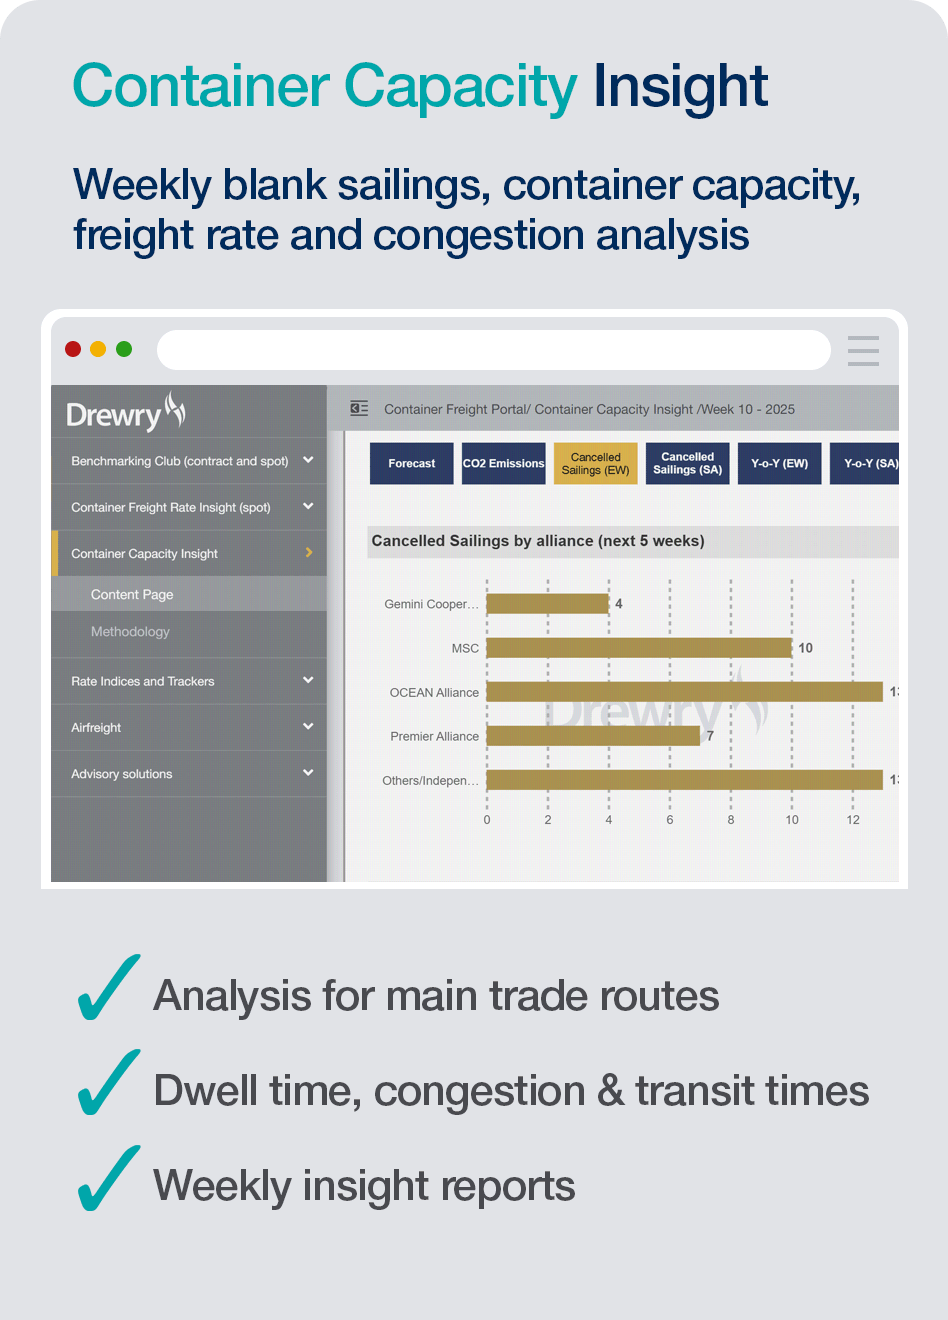
Weekly analysis of container capacity and cancelled sailings: With carriers continuing to carefully adjust their schedules to meet demand, access to a regularly updated picture of service availability is more important than ever. We closely analyse the various service and schedule data feeds to understand current container capacity and anticipated market development - by alliance across the main trades, and to provide historical context include year-on-year comparisons in the weekly analysis.
Find out more
© Copyright 2025 | Drewry Shipping Consultants Limited. All Rights Reserved. Website Terms of Use | Privacy Policy


