Supply Chain Advisors
Cancelled Sailings Tracker - 17 Oct
Our weekly Cancelled Sailings Tracker provides a snapshot of blank sailings announced by each Alliance versus the total number of scheduled sailings.
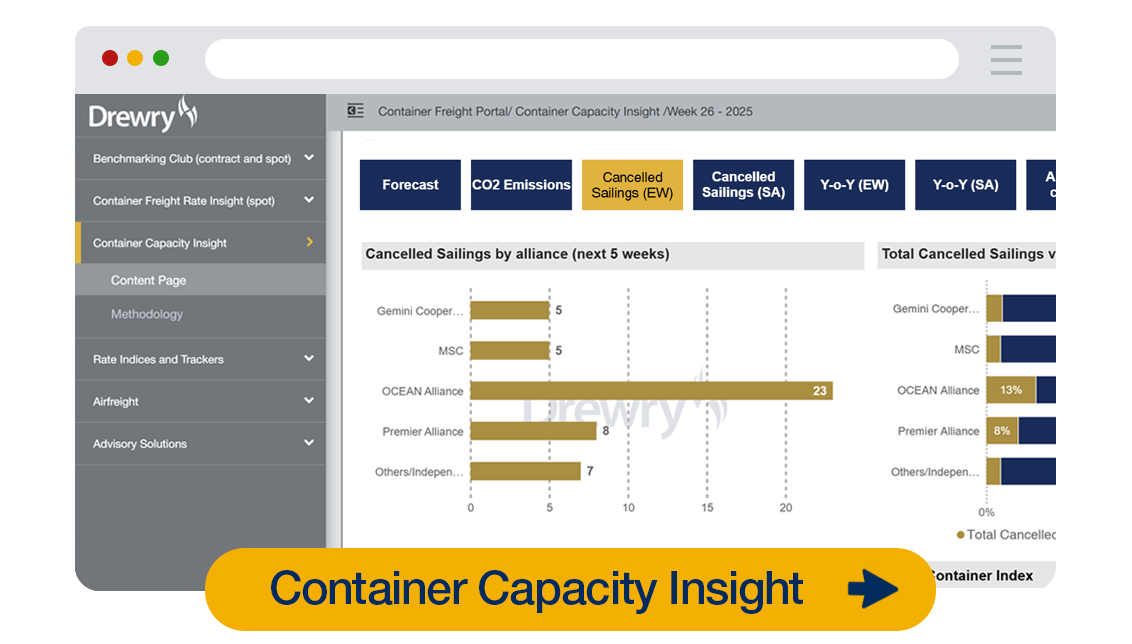
Further to the snapshot below, you may be interested in subscribing to our Container Capacity Insight providing more in-depth weekly assessments and analysis by main trade and alliance. This service includes effective capacity analysis, port congestion, dwell time and utilisation insights with year-on-year comparisons. Visual below not displaying? Click here
Weekly analysis: 17 Oct 2025
USTR fees escalate US–China trade tensions, though carriers say they won’t pass this cost to shippers
on US calls.
New port charges on Chinese vessels calling US ports—and retaliatory fees on US-linked ships entering China—have taken effect, adding hundreds of dollars per teu on operational costs and complicating trade flows. Nevertheless, operational impacts are set to remain limited as carriers are adjusting networks and reducing exposure.
Meanwhile, European labour unrest and capacity management measures such as blanked sailings and service suspensions are adding further pressure on the supply chain.
Between weeks 43 (20–26 October) and 47 (17–23 November), carriers have withdrawn 7% of scheduled sailings (51 out of 714) on key East–West routes, with 49% of cancellations on the Transpacific eastbound, 33% on Asia–Europe/Med, and 18% on Transatlantic westbound. During this period, 93% of weekly departures are expected to proceed as planned (see above).
Drewry reports carriers have announced 90 blanked sailings in October, up from 58 in September, with a 6% MoM reduction in capacity on key East–West routes. November is expected to see capacity rise 9% and cancellations fall to 52.
Freight markets have shown short-term resilience: Drewry’s World Container Index rose 2% WoW to $1,687 per 40ft on 16 October, ending a 16-week decline, with rates up 4% on Asia–Europe/Med, 1% on Transpacific, and 2% on Transatlantic.
Looking ahead, shippers are advised to plan proactively: secure space early, consider alternative routes, and monitor port schedules and service updates. Flexibility and close coordination with service providers are essential amid ongoing uncertainty.
Solutions for shippers...
If you’re an international shipper/BCO and would like to learn more about the targeted support and advice we can give to service provider contracts, budgeting and tender preparations this year, reach out to our team of ocean freight procurement and cost benchmarking experts at supplychains@drewry.co.uk.
Solutions for shippers/BCOs
Introduction to our Container Capacity Insight (annual subscription)
Find out more
Related Indices
World Container Index: Our detailed weekly analysis and latest freight rate assessments for eight major East-West trades.
World Container Index Index
IMO 2020 BAF Tracker: We’ve introduced a simple, clear indexing mechanism to help determine changes in the BAF charges during the lifetime of a contract.
Low Sulphur Bunker Price Index
Global Port Throughput: Every month we publish global Port Throughput Indices - a series of volume growth/decline indices based on monthly throughput data for a sample of over 220 ports worldwide.
Drewry Port Throughput Indices
Related Research
What our clients say about Benchmarking Club

“Drewry benchmarking [service] has provided us with the insights… to understand how we are positioned, especially important given the volatile and potentially irrational nature of the container marketplace.”
Anonymous, Global home furnishings business

“Drewry’s regular analysis and benchmarking tools help keep us informed on both our own freight rates as well as broader trends in the market. Their insights, reporting and forecasting capabilities truly support our strategic decision making.”
Peter Smith, Global Trade and Commercial Manager, Cotton-On Group

“We selected Drewry’s Benchmarking Club to benchmark our ocean rates with other retail industry leaders and to gain insight into container shipping market trends, forecasts and best practices through webinars provided to Club members by Drewry.”
Logistics Manager, Leading global electronics and home entertainment brand

“Drewry’s Benchmarking Club has made industry rate data and expertise readily accessible. We successfully leveraged their industry knowledge in our annual ocean carrier contract negotiations and continue to do so when evaluating changes to our organization’s sourcing strategies.”
Fortune 100, International US-Headquartered retail brand

“Benchmarking Club data allows us to see trends from both the market and Drewry point of view which provided strategic value on what to expect during the upcoming procurement process. The comparisons of our company’s position in transit times, rates and shipment methods are of particular value.”
Logistics Director, US FMCG Company

“Drewry has been very helpful to us in benchmarking our shipping costs and in developing strategies to improve our shipping efficiency and cost effectiveness.”
Head of Exports, Del Monte (Philippines)

“Drewry is a great resource for market insights, rate indices and guidance on overall market conditions. Our partnership with Drewry has proven advantageous to our business by helping us establish best practices, refine our contracts and benchmark among the best in the industry.”
Head of Logistics, US-based Top 50 Importer
Working with 3 of the top 10 global retailers (National Retail Federation)
Access to an exclusive ocean freight cost benchmarking club comparing costs on over 14 million teu of freight
The first to publish benchmark container spot market freight rates back in 2006.
Related Maritime Research
Track the spot market
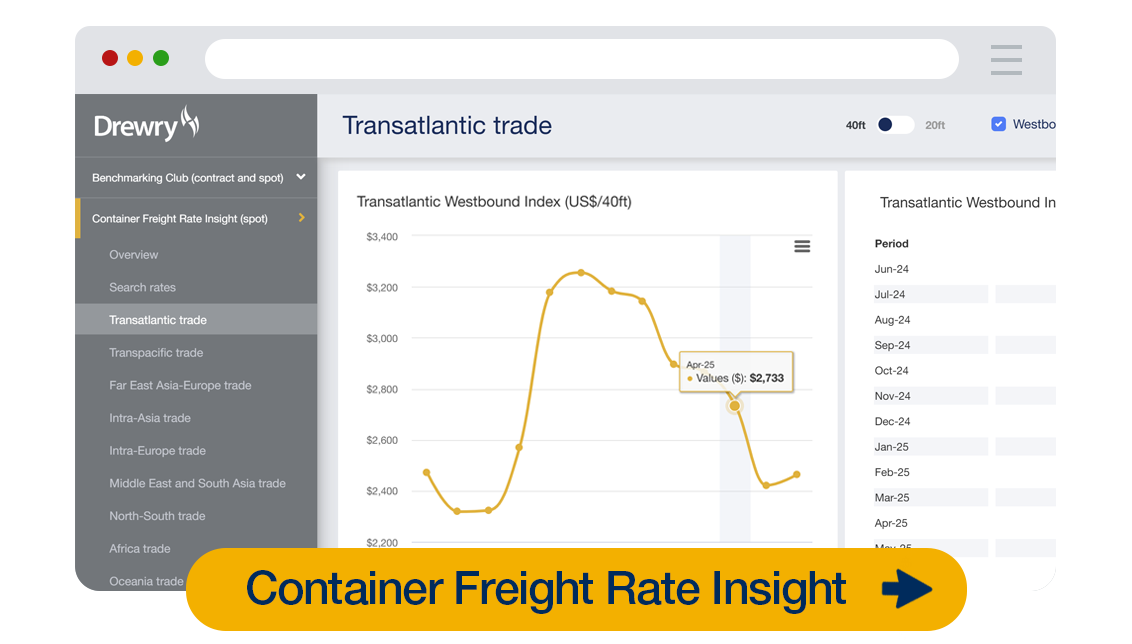
Keep up to date with the movements of container spot market freight rates with our popular Container Freight Rate Insight service.Benchmark contract rates
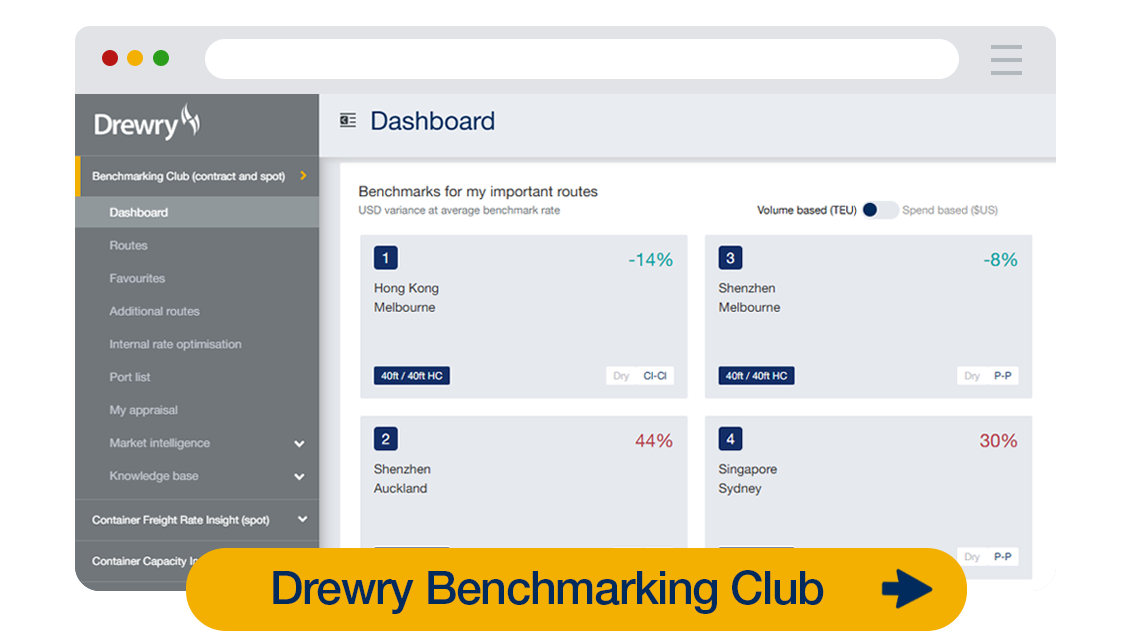
Join our exclusive Benchmarking Club and find out how your contract rates compare to your peers.Monitor your carrier
Understand how your carriers are performing with our online Carrier Performance Insight service.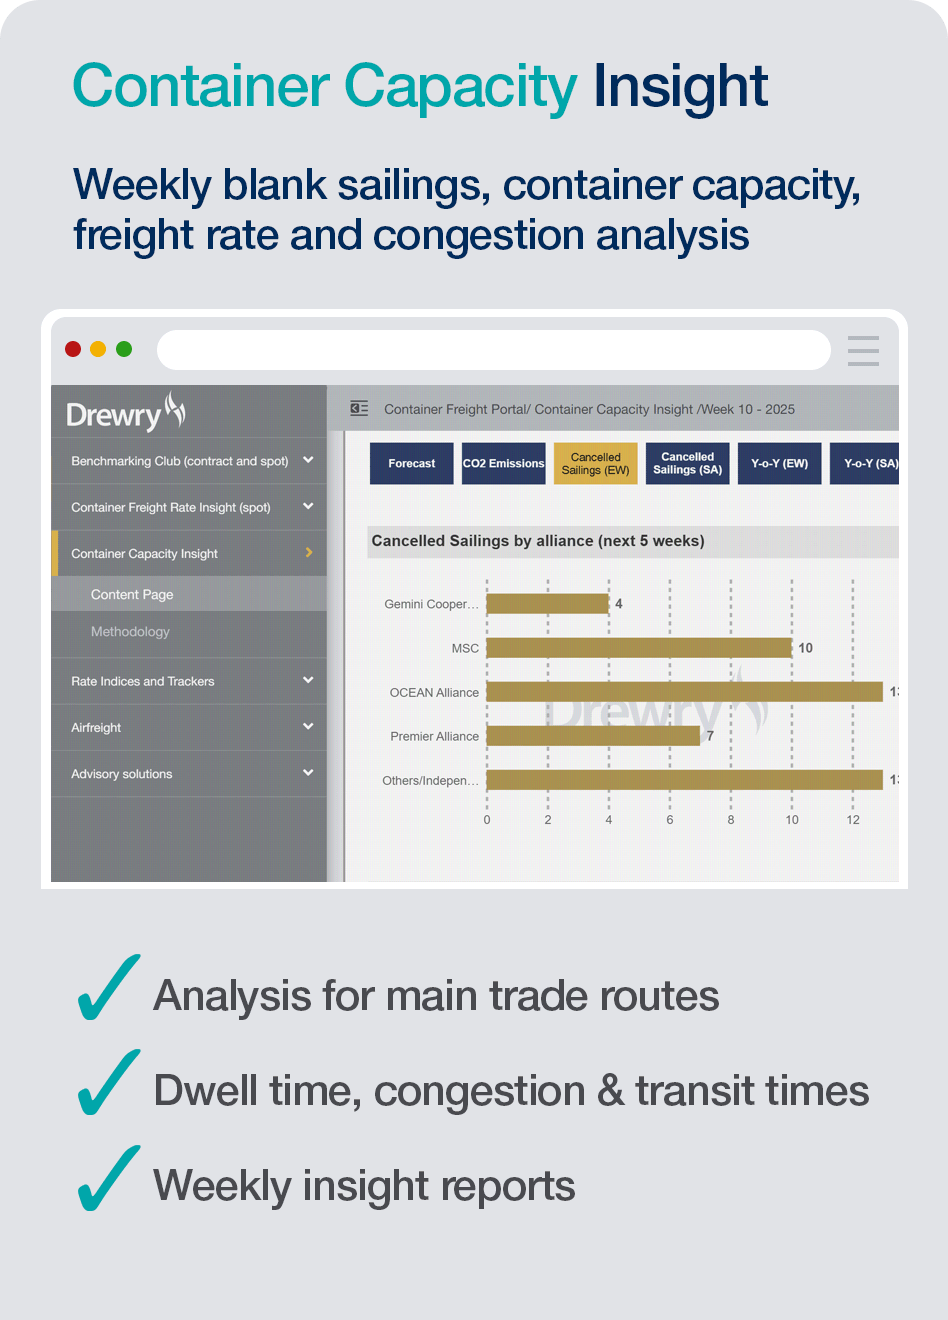
Container Capacity Insight (Annual Subscription)
Weekly Insights · Latest release 01 Oct 2025
Learn more
View more
© Copyright 2025 | Drewry Shipping Consultants Limited. All Rights Reserved. Website Terms of Use | Privacy Policy

