Maritime Research
Port Throughput Indices
The Drewry Container Port Throughput Indices are a series of calendar adjusted volume growth/decline indices based on monthly throughput data for a sample of over 340 ports worldwide, representing over 80% of global volumes. The base point for indices, January 2019 = 100.
Drewry has developed a nowcasting model that uses vessel capacity and terminal duration data (derived from our proprietary AIS model) to make short-term predictions of port throughput.
Drewry Global Container Port Throughput Indices
Source: Drewry Ports and Terminals Insight (Jan 2019 = 100, calendar adjusted)
Chart not displaying? Click here to display this chart in a new window
Drewry’s latest assessment
- Drewry’s Global Container Port Throughput Index decreased 1.5% MoM in October, but remained up 5.6% YoY, and the rolling 12-month average growth rate for global port handling fell to 6.0%. As 2025 has progressed, YTD growth, which reached 5.7% for our sample, has persistently outpaced the full year forecasts which have been regularly upgraded to reflect latest trading conditions. Growth continues to be driven by the Middle East and South Asia region, up 11.3% YoY and 8.7% YTD, ably assisted by Latin America (up 10.6% YoY and 6.8% YTD) and Africa (up 10.9% YoY and 6.5% YTD).
- TThe Greater China Container Port Throughput Index fell 1.8% MoM in October, up 7.3% YoY. The 12-month average growth rate in Greater China rose to 5.5%, remaining below the global average of 6.0%. Throughput growth across the major ports of Greater China was varied in October, although all of them except Hong Kong remain ahead of last year. Shanghai volumes fell 6.2% MoM, but were up 9.2% YoY. The Pearl River Delta ports recovered from the impact of Super Typhoon Ragasa in October-Shenzhen volumes jumped 18.8% MoM and 11.7% YoY, while at Guangzhou they surged 14.4% MoM, up 2.0% YoY. Hong Kong also recovered in the month, with volumes up 14.6% MoM, although lower by 7.0% YoY.
- The North American Container Port Throughput Index fell 4.1% MoM in October to 111.0 points, down 1.9% YoY. The rolling 12-month average growth rate reduced to 4.9%, well below the global average of 6.0%. Volumes at major ports across the region saw volumes drop MoM in October, ranging from Los Angeles (-3.9%), New York (-1.8%), Savannah (- 6.8%), Vancouver (-5.4%) and Lazaro Cardenas (-10.2%). Taken alongside the fall in September throughput, this data seems to confirm Drewry’s view of an early end to the peak season.
- The European Container Port Throughput Index fell 5.2% MoM in October, marking a 0.5% YoY decrease to 105.9 points. The rolling 12-month average growth rate dropped to 5.7%, falling below the global average of 6.0%. Volumes at some of the major ports in Northwest Europe have been weaker than expected. October throughput at Antwerp Bruges dropped 12.6% MoM, down a massive 21.1% YoY. Ports in the Mediterranean have fared much better-volumes at Valencia rose 5.5% MoM and 5.5% YoY, while at Algeciras they were up 2.9% MoM and 8.9% YoY.
* Note that the index figure for Africa is based on a relatively small sample, and so should be viewed with caution
# Figures for Oct 2025 include some estimates of port throughput data which are subject to subsequent revision
Ports and Terminals Insight
Related Research: Port and Terminal Sector
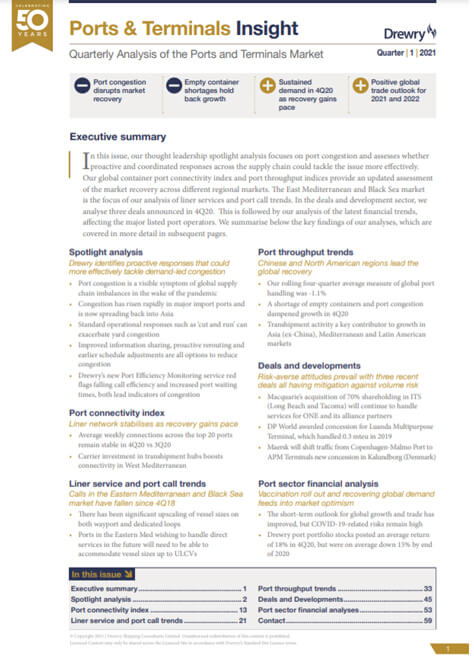
For access to port traffic data behind these Port Throughput Indices, along with the latest port call and port performance analytics, subscribe to Drewry’s Ports and Terminals Insight. Together with quarterly report (PDF) covering the latest developments in the container ports and terminals market, subscribers also receive a monthly update (PDF) providing the latest port congestion and performance insights powered by Drewry AIS analytics. Ports and Terminals Insight looks behind the data and market trends and issues to answer both the ‘cause’ and ‘effect’ questions that matter most to senior industry stakeholders.
Monthly PDF reports updates provide analysis of port performance and congestion across global and 8 regional port markets:
- Monthly port throughput growth trend analysis
- Port call analytics and development trends
- Port performance monitoring, broken-down by:
- Pre-berth waiting time
- Terminal time
- Other time
- Port congestion heatmaps by region
- Pre-berth waiting time analysis comparisons across selected ports
21
Market sectors covered
37
Countries with subscribing Maritime Research clients.
86
Leading industry publications feature content from our Maritime Research reports each month (2024 monthly average)
332
New reports and title updates released in the 12 months before December 2024
Latest Maritime Research
Complete coverage
From tankers to dry bulk, containers to ports - we keep a constant watch on the world's maritime marketsRich heritage
More than 40 years continuously charting and analysing the world's maritime marketsProudly independent
Our voice is our own and is not defined by others
Ship Operating Costs Annual Review and Forecast 2025/26
Annual Review and Forecast · Latest release 07 Nov 2025
Learn more

Container Forecaster (Annual Subscription)
In-depth - scenario-based market forecasts · Latest release 23 Dec 2025
Learn more
View more
© Copyright 2026 | Drewry Shipping Consultants Limited. All Rights Reserved. Website Terms of Use | Privacy Policy


